When will this COVID wave be over? Four numbers to keep an eye on and why


Before Australia’s recent changes to COVID testing, working out when we reached the peak of cases was, in principal, straightforward.
We looked at the numbers of new daily cases, diagnosed via PCR. From there, we worked out a range of other key indicators related to COVID spread, testing and hospitalization—each dependent on those daily case numbers.
However, we’ve seen a huge spike in cases recently as people test positive using rapid antigen tests, especially as reporting their results to state health authorities is now possible and becoming mandatory.
So it will be a few days before we can measure some key numbers with any degree of accuracy. Only then will be able to say with confidence when we’ve hit the peak and are coming down the other side.
1. The number of new daily cases
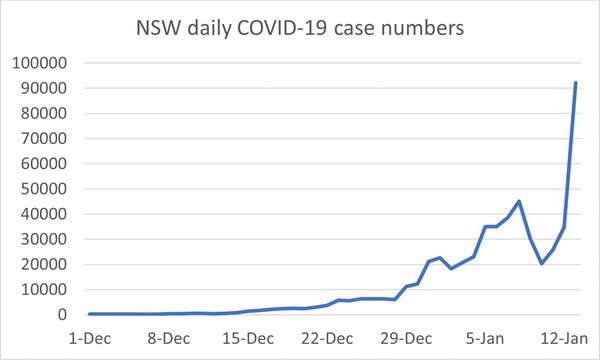
Most people by now would have seen an epidemic curve. It is a plot of the number of new cases of COVID-19 diagnosed each day. Here is the current epidemic curve for New South Wales.
As for the date, states and territories use different cut-off times for defining a 24-hour period. As authorities undertake investigations, the date of some cases can change. So, do we plot the daily announced case numbers, or the “true” case number after modifications?
That sounds complicated, but even more complicated is trying to define a case.
Before rapid antigen tests became available to the public for use at home, cases were diagnosed from positive PCR tests.
Then, because of huge queues at PCR testing hubs and many people, even those with symptoms, giving up and not getting tested, our testing system changed.
National Cabinet agreed to remove the requirement for a PCR test to confirm a positive rapid antigen test result.
As most states and territories move towards reporting both positive PCR tests and positive rapid antigen tests, we still need to iron out the bumps in the data. Potentially, someone could get both tests and be included twice!
The uncertainty in case numbers also affects other key parameters we use to monitor the current wave.
2. The Reff
The effective reproduction number (Reff) is a measure of how many other people on average each case infects. We want that to get below 1 to stop an outbreak. At its most simple, the Reff is today’s case number, divided by the case number four days ago.
Since we currently have so many problems defining and counting case numbers, it will be a few days before we can consistently interpret the Reff for each state and territory again.
3. Percentage of positive tests
This is the percentage of positive tests out of all COVID-19 tests taken. It is an important measure as it gives an indication of the amount of undiagnosed cases in the community.

The World Health Organization suggests if it is under 5%, things are under control.
When diagnosis was only by PCR test, we had good data on both the number of tests, and the number that were positive.
Now, states and territories are moving to reporting rapid antigen test results, it’s not so straightforward.
Some jurisdictions like Queensland only ask you to report a positive result. This means we no longer know how many tests were taken. SA Health is encouraging people to report negative tests as well, which is a much better system.
4. Number hospitalized
As Australia opens up, we’ve been told to pay more attention to COVID-19 hospitalisations, rather than just the case numbers. But even that gets complicated.
Clearly if someone tests positive for COVID-19 and then gets admitted to hospital, they are an admitted case. But what if they are admitted as a probable case?
And should hospitalization numbers include people being managed in a hospital-in-the-home type arrangement? After all, they still take up hospital resources.
Finally, what if they were admitted for something else but subsequently diagnosed with COVID-19 in hospital?
Even more difficult is attempting to calculate the rate of COVID-19 hospitalization. This is the number of people in hospital with COVID-19 divided by the number of people diagnosed. But you have to decide which time periods you’re talking about, another debate entirely.
There are similar issues with measuring the number and rates of people in intensive care.
How do these changes impact modeling?
NSW Health recently released modeling to look at what’s ahead.
With current restrictions in place in NSW, the modeling shows a peak of 4,700 hospitalisations, with 273 in intensive care over mid- to late January.
It is unclear whether changes to testing rules have been factored into the modeling. However, it’s understood, even if the detection rate changes significantly, it doesn’t affect any projection of when the peak will be reached that much.
Modeling is therefore still likely to be reasonably accurate despite the changes to COVID testing. This is good news for other states and territories that rely on modeling results for planning.
Where to from here?
A good start would be to have mandatory reporting of rapid antigen test results, both positive and negative. That way we can calculate the percentage of positive tests again.
The United Kingdom has a good system. After you take a rapid antigen test there, you scan a QR code on the pack and report the test results as positive, negative or void to a central government database.
Source: Read Full Article


